Wireshark for Security Analysis | Customization & Common features

1/ Introduction
What is Wireshark?
Some intended purposes
- Network administrators use it to troubleshoot network problems
- Network security engineers use it to examine security problems
- QA engineers use it to verify network applications
- Developers use it to debug protocol implementations
- People use it to learn network protocol internals
- Wireshark can also be helpful in many other situations.
2/ Customizing Wireshark
Create a profile for your security analysis
Wireshark profiles are used to configure and use more than one set of preferences and configurations;
creating profiles is critical for better visibility, it will make your analysis far more organized and effective, so when you want to analyze different protocols or exercises you can save a set of settings specific for each type of use
Right-click on Profile:Default > New > Name it > Ok


Change the timestamp
Changing the time is a good practice for better visibility; Wireshark offers many time formats that you can choose from, choose your system time display format if you want to analyze events based on your local machine time, or UTC if you work remotely with multiple clients, you can also choose the time granularity from seconds to nanoseconds; the bottom of the line is that you have the choice on which format you prefer to work with based on your own needs
View > Time Display Format

Save filters as buttons
Since you're going to use filters excessively while investihttps://ahmedbelhadjadji.blogspot.com/2022/01/httpsahmedbelhadjadji.blogspot.comazure-sentinel-to-map.htmlgating, storing filters as buttons is truly a time saverEnter your filter expression > hit the "+" icone > Name it > Ok


Nb: if you want to nest filters, we name as following: Parent node // child node
Coloring rules
View > Coloring rules > hit the "+" icon > set the filter and name it > choose a background color > Ok


3/ Common Features
Statistics
Wireshark provides a wide range of network statistics which can be accessed via the Statistics menu.These statistics range from general information about the loaded capture file (like the number of captured packets) to the statistics about specific protocols (e.g. statistics about the number of HTTP requests and responses captured).
one useful statistic is the Protocol hierarchy, it provides the protocols in your capture

as you can see at the capture below that I have 4 ARP, 2 ICMP, 6 IGMP, TCP, and UDP packets

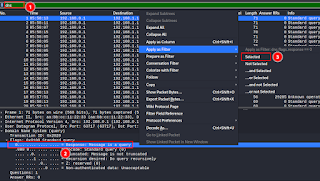
another commonly used statistic is the conversations

Right-click > Apply as a Filter > Selected > A <-> B
I found that that port UDP:5353 is used for Multicast DNS
Identify GeoIP location resolution
We used this feature in Azure SIEM by using APIs to extract the Geolocation information AzureMapyou can download the GeoIP databases from maxmind.com and add them to Wireshark
you can also get the databases from here github.com/GeoLite.mmdbgo to Edit > Preferences > Name Resolution > MaxMind database directories > "+" > browse to the downloaded folder > Ok

if the changes don't appear instantly, you may want to restart Wireshark
we can try now another statistic we didn't talk about earlier
go to Statistics > Endpoints
you can take a good look at the external traffic you're connecting with
Map > Open in Browser

Custom columns
to add a column you can select a packet and go to the field you want to add a column for >Right-click > Apply as a Column

right-click on it > Edit Column > modify the Fields > Ok
in my case, I was looking for a column to show the source port either UDP and TCP, so I added “or tcp.srcport”
Name resolution
we can configure Wireshark to resolve transport names (like protocols)Edit > Preferences > Resolve transport names
we can also resolve network addresses into hostnames, we have three options on how the name resolution is performed: Wireshark captured DNS packets, an external name resolver, or using selected DNS serverswe can also use the manual resolution to name a specific device, a client's IP for example

Comments
Post a Comment